The Invoice tab contains graphs show invoices in process, your largest vendors and statistics on the automation of your invoice flow.
At the top of the page, you can choose which companies you want to see and whether you want to show all invoices or distinguish between order and cost invoices.
All graphs can be clicked on to open a list of the invoices, the list can then be exported in the same way as the search results.
The graphs on the tab Invoice are:
- Approaching due date
- Assigned invoices
- Invoices in stage
- Vendors
- AutoCoded
- AutoFlow
- Touchless
- Average handle time
Approaching due date

Here you can view invoices by due date.
Choose the number of days forward you want to see.
The graphs show the amount for each date, if different default currencies are used in the selected companies, one graph/currency is displayed.
Click on the graph to view the invoices.
Assigned invoices
The chart shows the users who have invoices in their queue and the stage they are in.
Filter the list by typing in the text box.
Click on a bar to see a list of these invoices.

Send reminder to users
Here it is also possible to send a reminder to the users in the list.
Tick the users you want to send to and click on 

Add or remove recipients, write a message and click on Send.
Invoices in stage
The chart Invoices in stage shows how many invoices are in each stage of the process.
Click on a bar to see a list of these invoices.

Top vendors
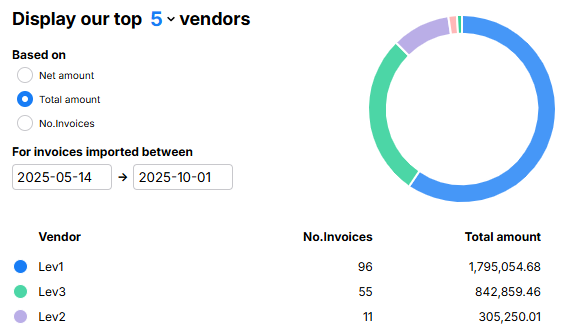
- Select the number of vendors you want to see statistics on.
- Choose whether the figures should be based on net amouunt, total amount or number of invoices.
- Select the date period you want to see.
- Click on the chart to see a list of these invoices.
Autocoded
Percentage of invoices automatically coded. Click on the graph to see statistics for different companies and vendors.

Autoflow
Shows the percentage of invoices that are automatically sent to the correct reviewer and/or approver.
Click on the graph to see statistics per company and vendor.
Please note: If you use control steps in your workflow, the figure may appear lower than expected. Invoices that pass through a control step are counted as manual processing and are therefore not included in the statistics for automatic distribution.
Touchless
Percentage of invoices that have passed through the invoice flow without manual handling. This means that the invoice is coded via coding suggestions and has not stopped in manual steps such as New invoice review, control before approval or control after approval.
Click on the graph to see statistics for different companies and vendors.

Average handle time
How many days does it take for an invoice to go through the entire invoice flow, from arrival day to final posting?
Click on the graph to see statistics for different companies and vendors.
